Data Visualization Suite

COURSE
Business Intelligence with Visual Analytics (16:137:553)
INSTRUCTOR
Lindy Ryan
DESIGN BRIEF
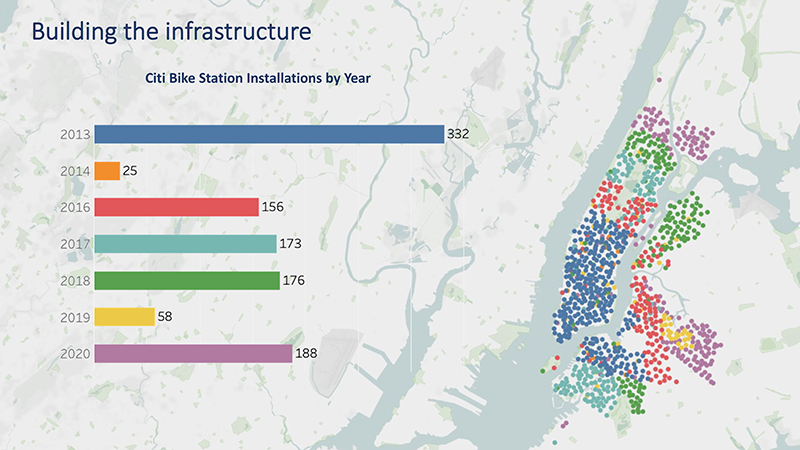
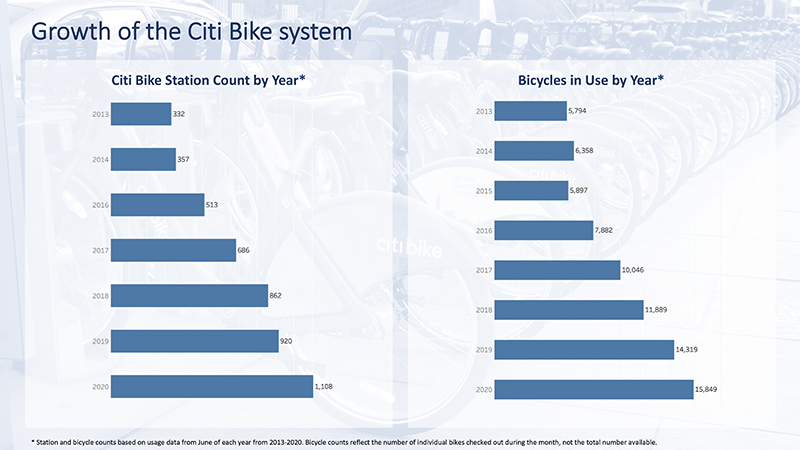
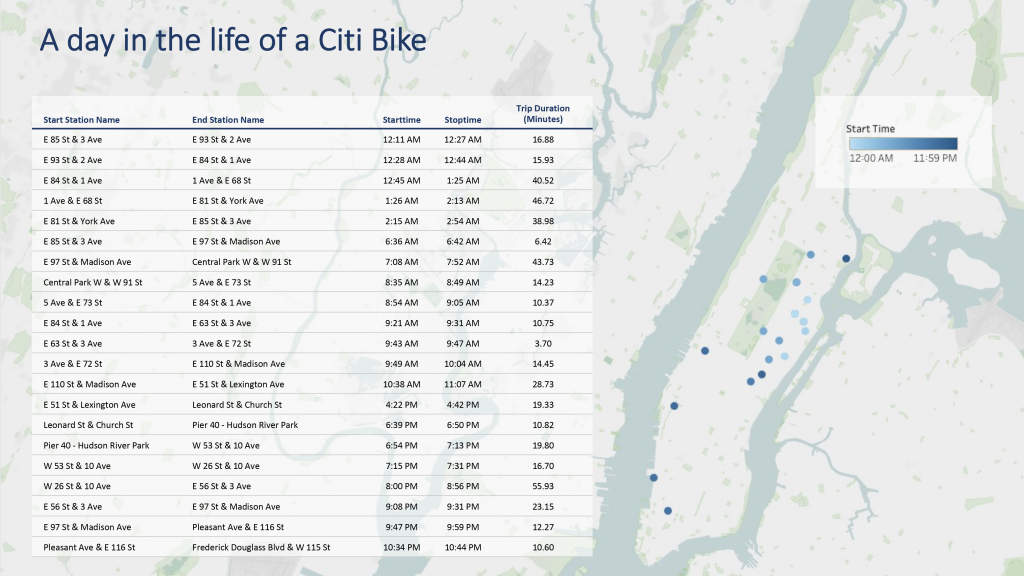
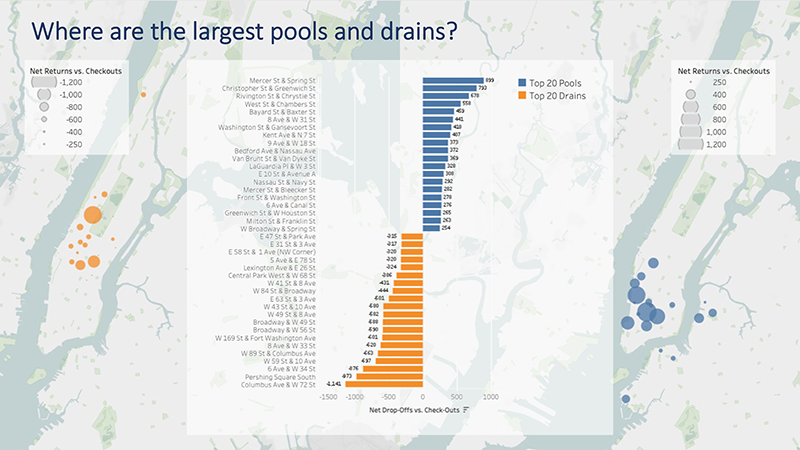
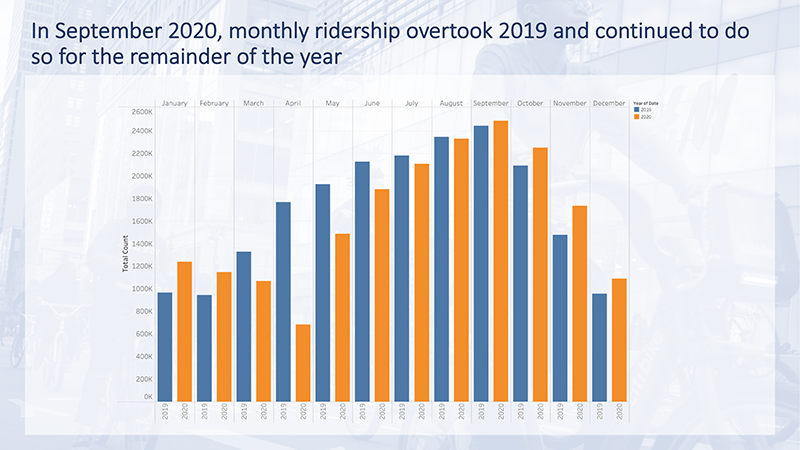
Create a suite of exploratory and explanatory interactive graphics from a large dataset of the designer’s choosing. For the project I chose the daily usage data for the CitiBike bike share program in New York City for the years 2013-2020.
DESIGN TASKS
Gathering seven years of published data regarding the operation of the CitiBike system
Coding Python script to convert the data into a usable format for the data visualization tools in use
Creating data visualizations in Tableau
Creating a Powerpoint presentation of findings
TOOLS USED
Python, Tableau, Powerpoint
LINKS
Exploratory Visual Analysis (PDF)