Prototype: Graph Creation Tool

COURSE
Information Visualization and Presentation (17:610:554)
INSTRUCTOR
Anselm Spoerri
DESIGN BRIEF
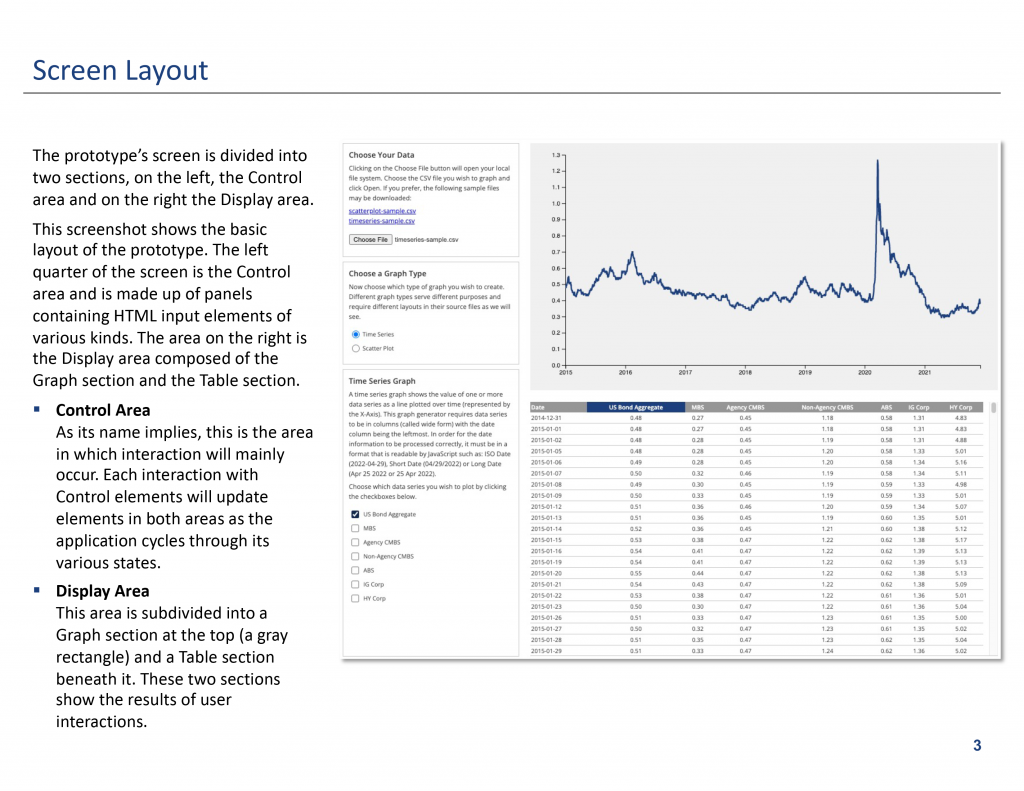
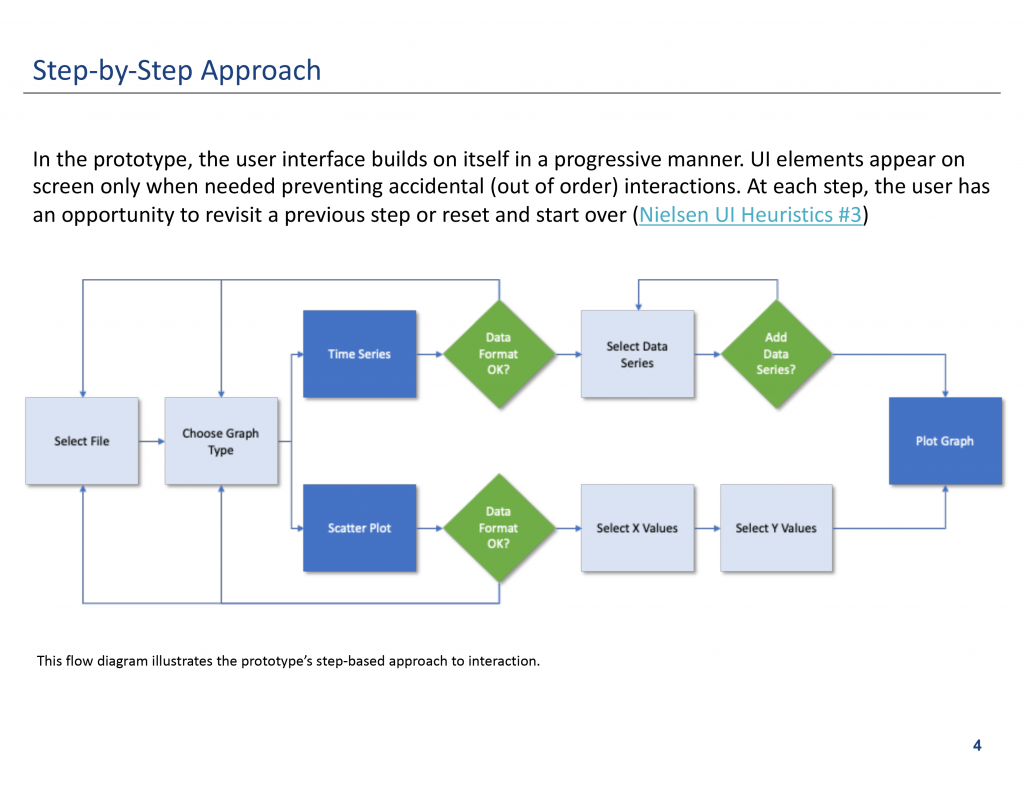
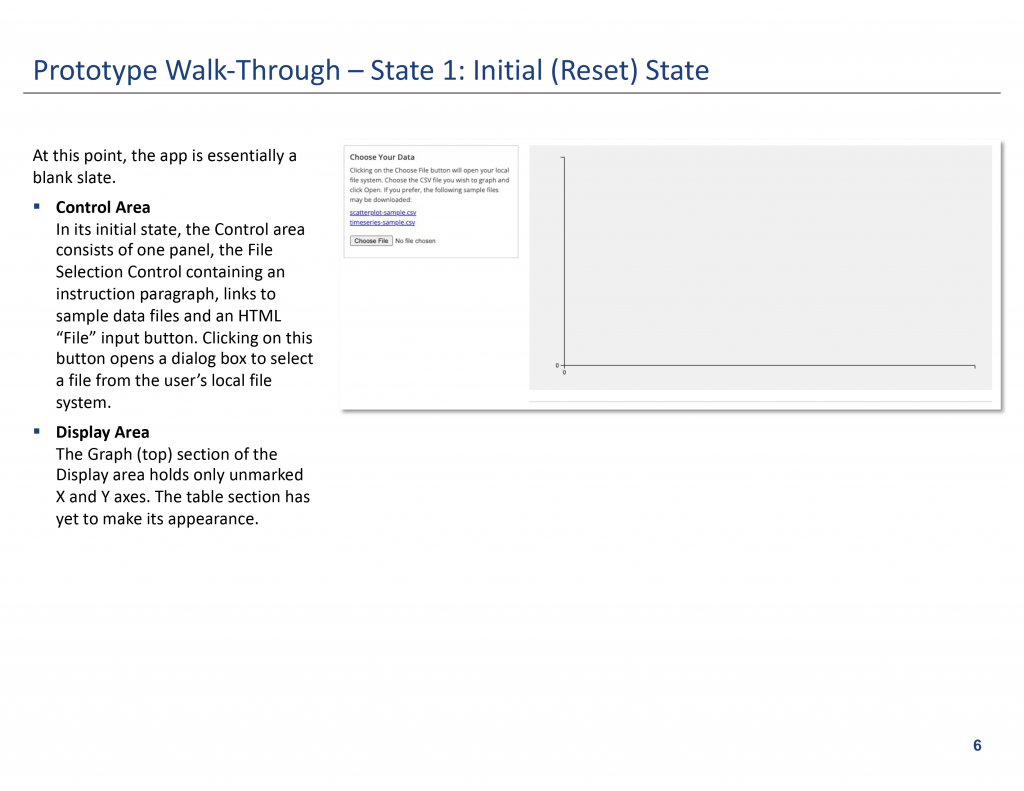
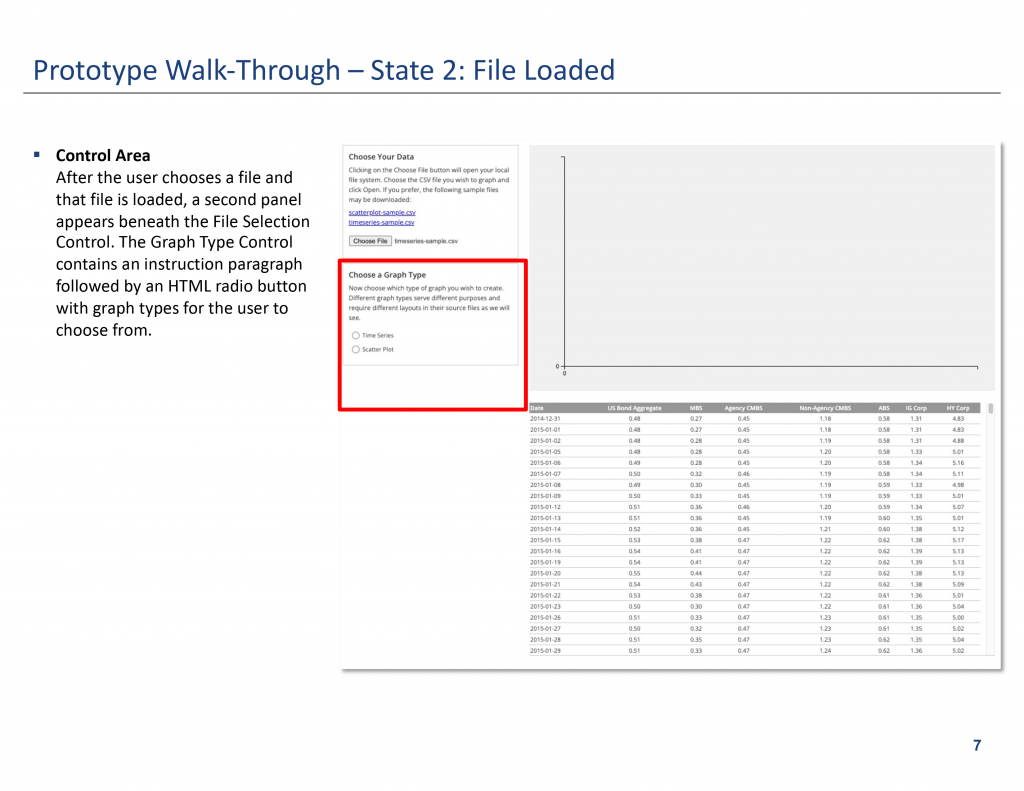
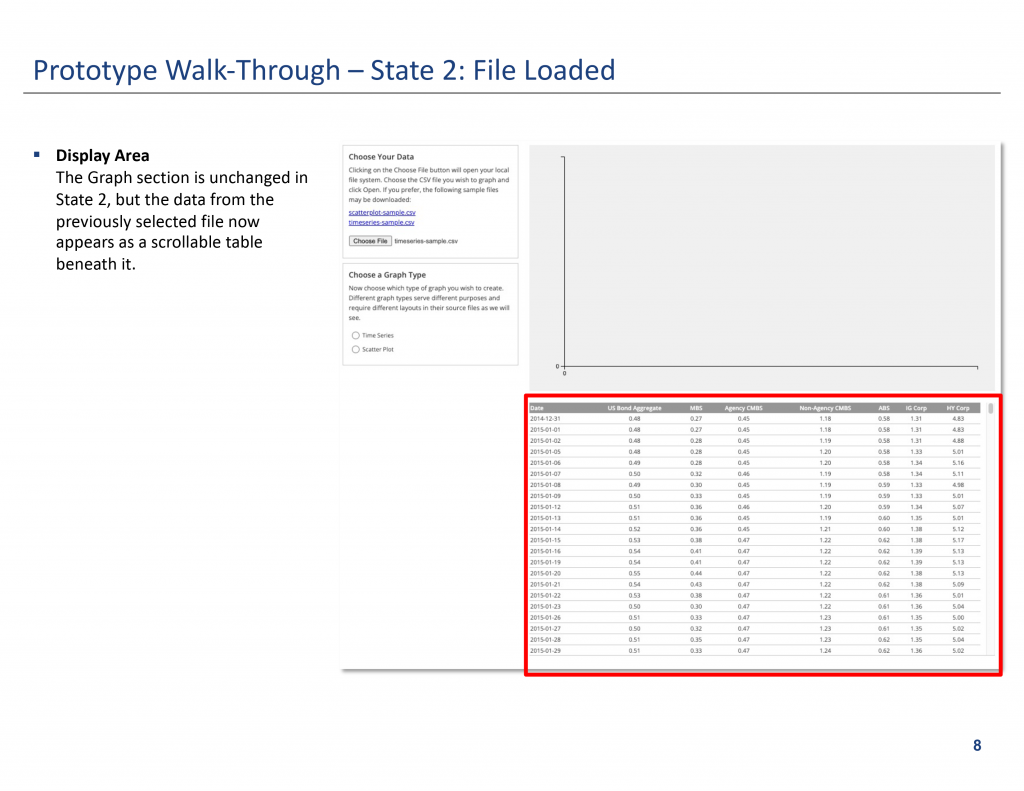
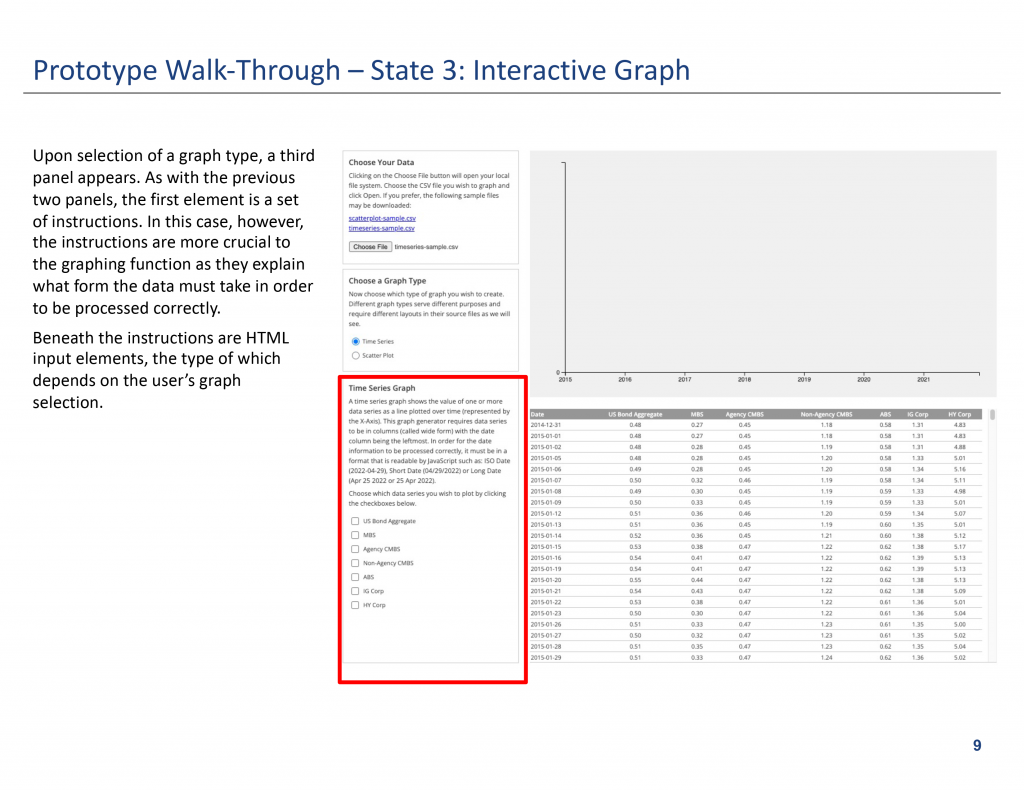
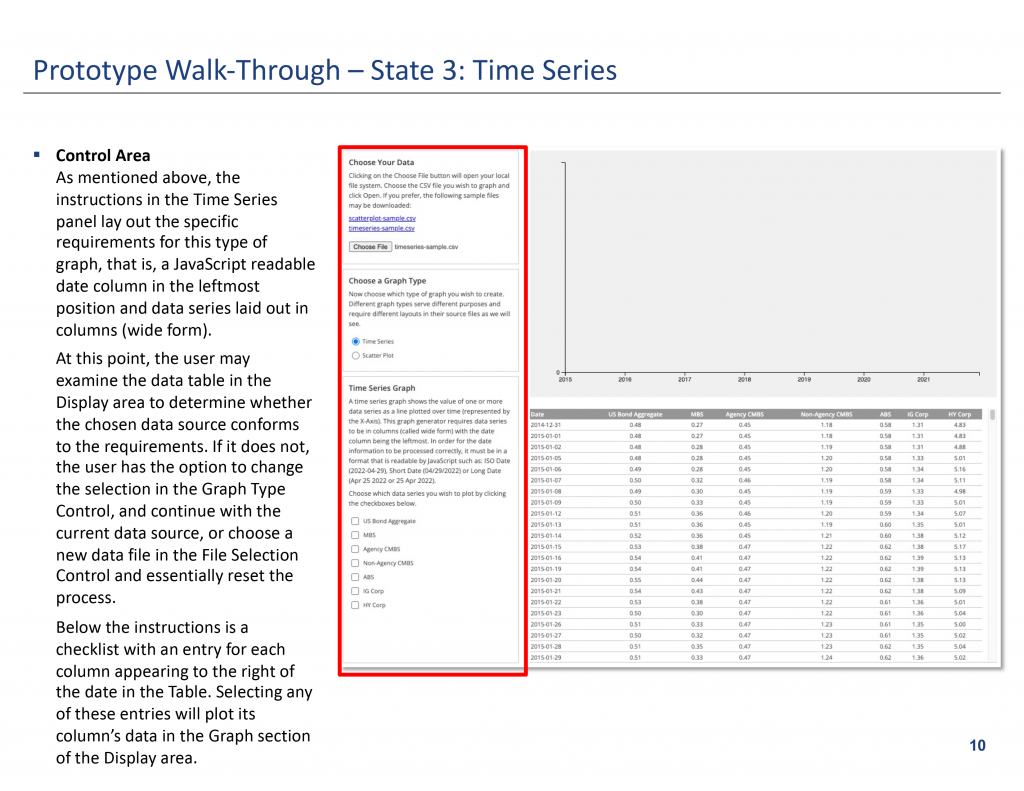
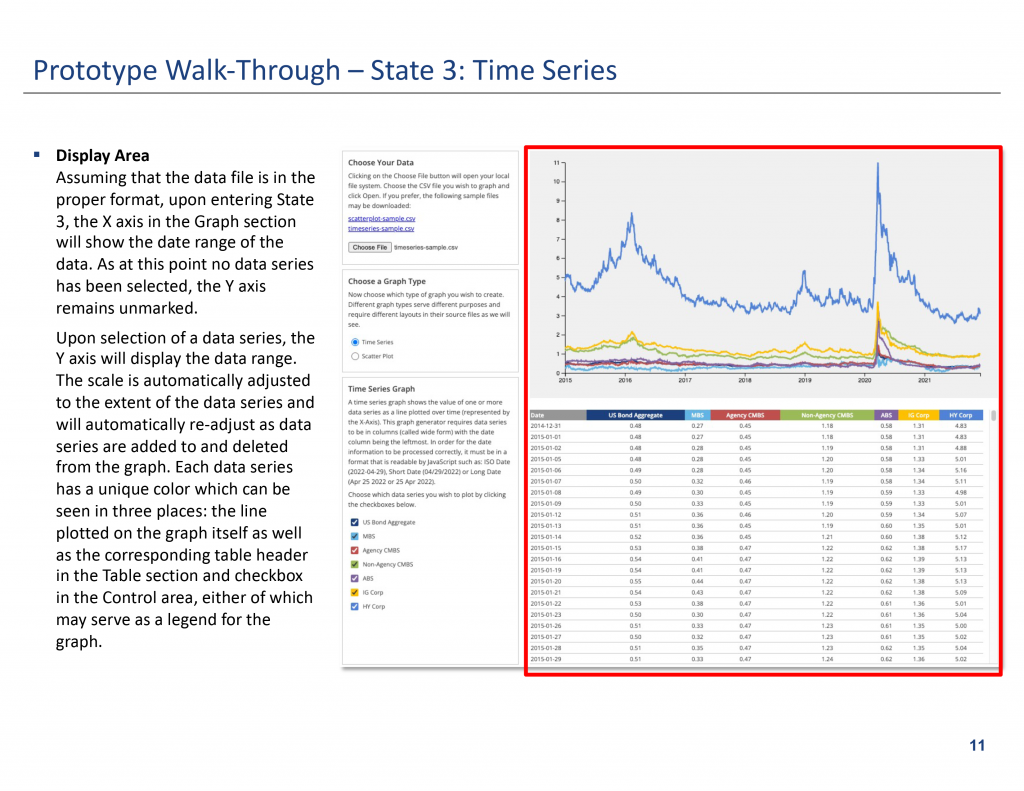
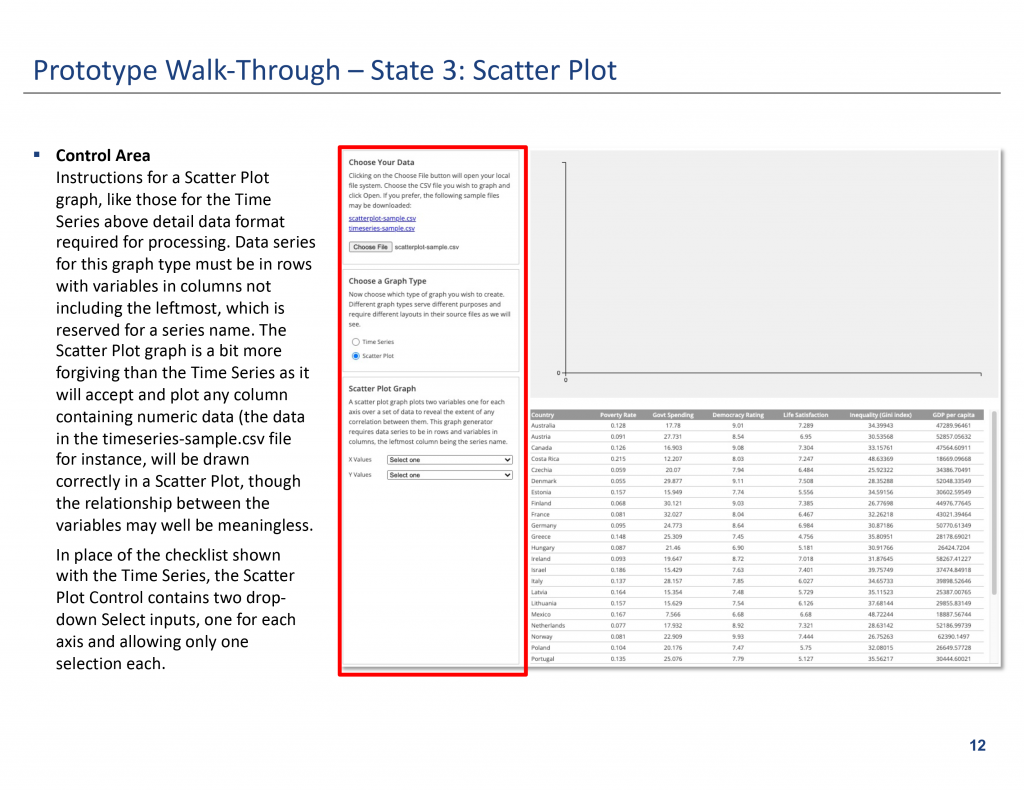
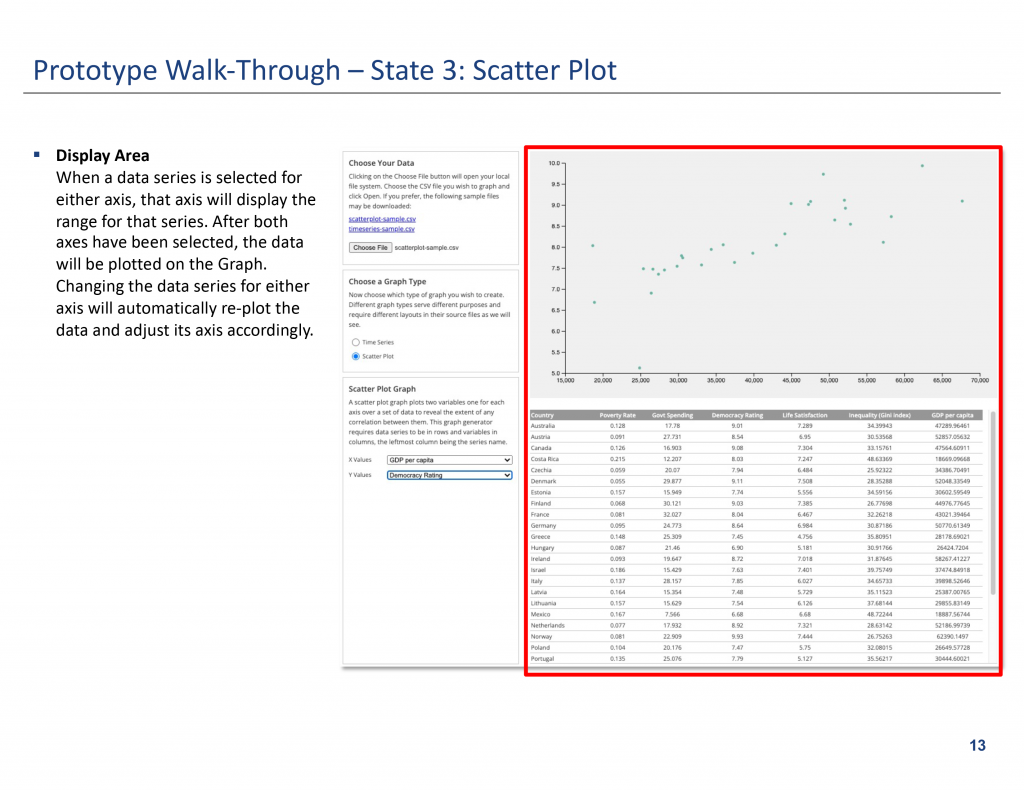
Create a web browser-based visualization tool which allowed a user to upload data and create a customized interactive graph and/or table.
DESIGN TASKS
Draft and submit design proposal
Design and build of a working prototype using HTML, CSS, JavaScript and D3
Solicit domain expert evaluation and feedback and submit evaluation report
TOOLS USED
HTML, CSS, JavaScript, D3.js
LINKS
Instruction Slides from Project Slide Presentation